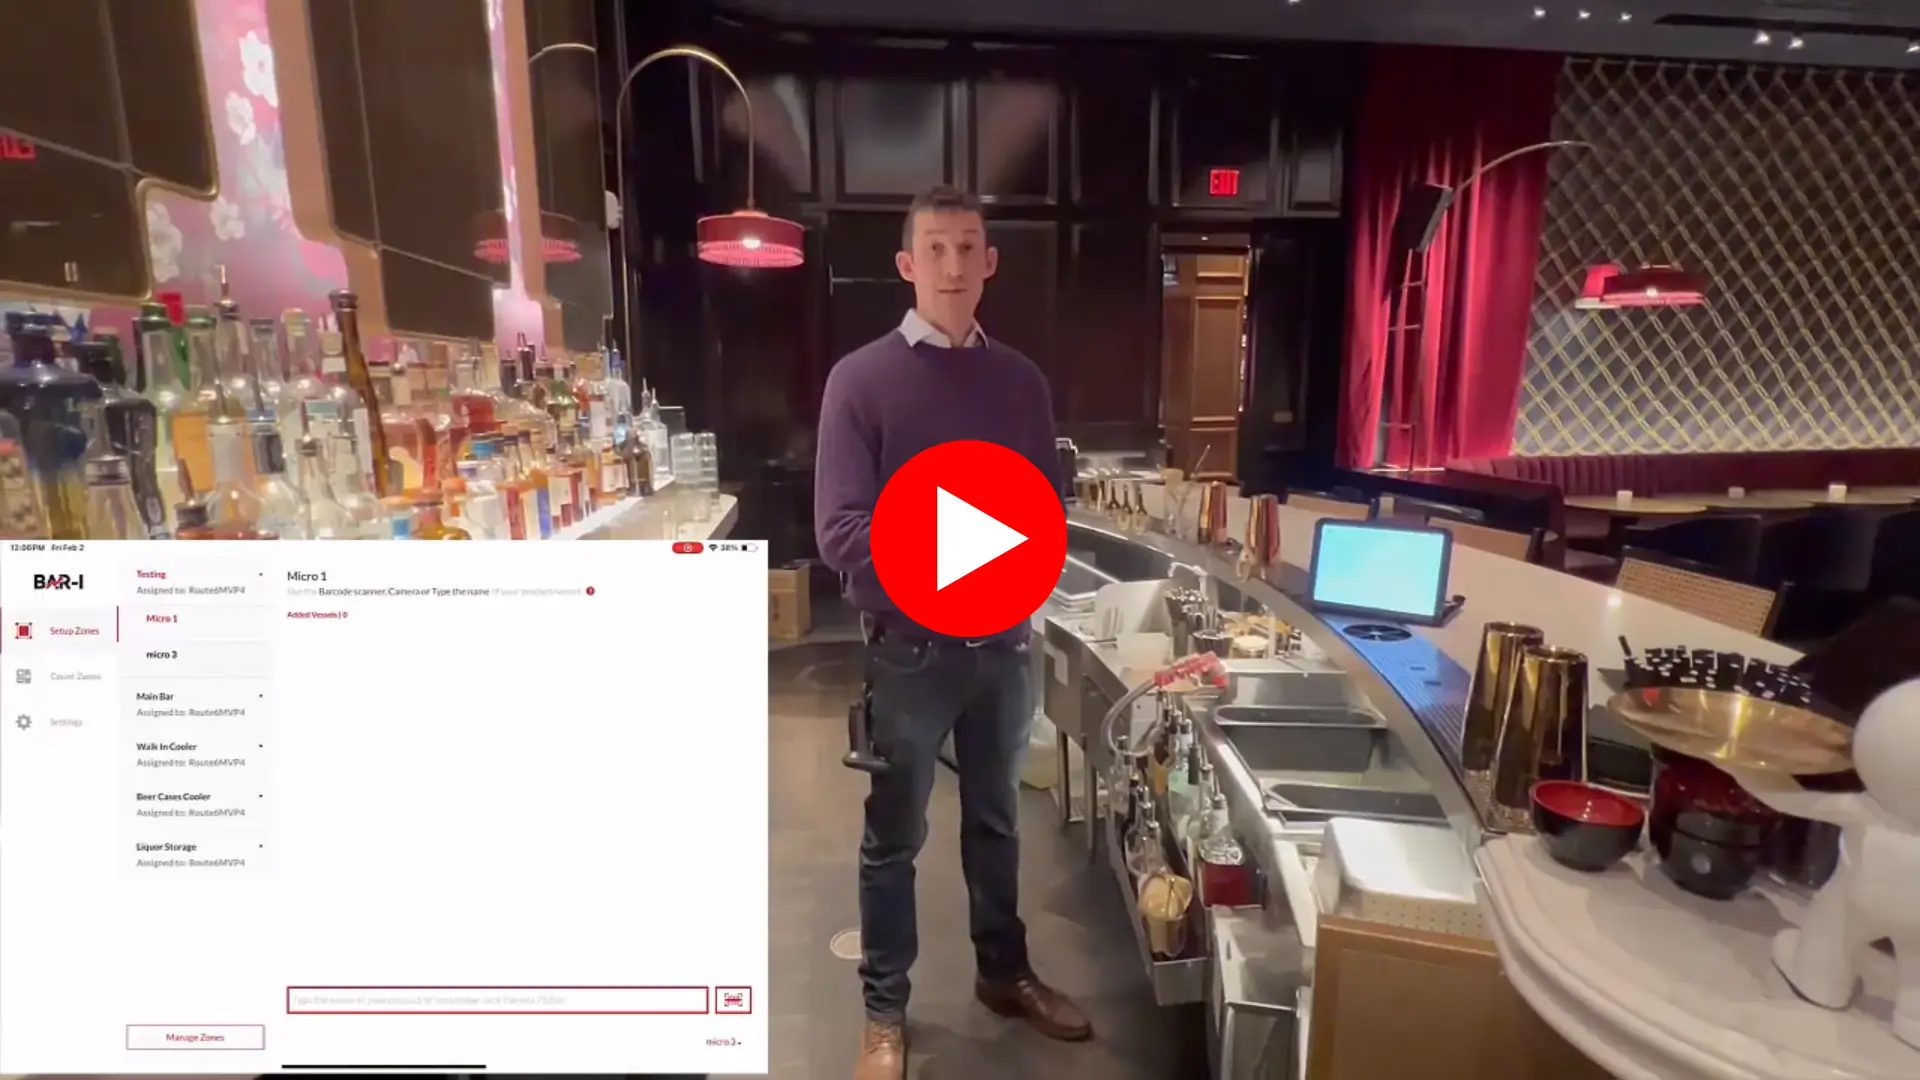
00:00:02,700 this is Jamie with bar I
00:00:04,666 welcome back to our how it works video series
00:00:06,900 where we explore the different modules
00:00:08,900 or functions of our inventory system
00:00:10,700 so you can decide if it'll be a good fit for inventory
00:00:12,833 at your bar
00:00:14,466 in this video we're looking at
00:00:16,233 perhaps the most important thing after counting
00:00:18,066 which is the end result the analytics
00:00:20,266 or what we like to call
00:00:21,433 our down to the serving approach to inventory
00:00:24,266 what we see a lot of people doing when they come to us
00:00:26,966 is they are stuck on doing inventory at a basic level
00:00:30,200 to see what needs to be ordered
00:00:31,766 or at level 2 level
00:00:33,600 where they're calculating liquor cost by category
00:00:36,300 the problem with measuring liquor cost by category
00:00:39,233 is that you can see how much money you're making
00:00:41,500 but you can't see
00:00:42,366 enough detail to see where you have problems
00:00:44,166 and therefore
00:00:44,500 where the opportunities are to make more money
00:00:47,033 having done this and measured this all over the country
00:00:49,900 thousands of times for bars
00:00:52,766 we see that the average bar
00:00:54,233 that is not doing down to the serving inventory
00:00:56,200 is pouring
00:00:58,066 15% more alcohol than what they're actually selling
00:01:00,966 so they account and sell 85% of what they pour
00:01:04,100 and everything else is just being given away
00:01:06,733 and they're losing retail dollars because of that um
00:01:10,366 so let's take a look at a completed
00:01:12,100 Pro version set of results
00:01:13,866 and imagine what
00:01:15,433 down to the serving means for your bar
00:01:24,833 so here we have a completed set of results
00:01:29,100 and the single most important number on a bar I report
00:01:31,833 is the accountability percentage for the bar
00:01:34,266 so this bar is scoring a very healthy
00:01:36,600 basically 98%
00:01:38,000 meaning that they accounted for 98% of what was poured
00:01:41,166 and they're only missing 2%
00:01:44,033 again that compares to an average bar missing 15%
00:01:47,166 and scoring 85 in accountability
00:01:49,400 we obviously break that number down
00:01:51,666 by the main categories this is
00:01:53,200 to be honest almost perfect results
00:01:55,433 and we also can measure the number of servings
00:01:57,766 missing in each category
00:01:58,700 so we see these guys are missing 380
00:02:01,200 biggest amount coming from draft next is from liquor
00:02:06,266 having this detail means we can calculate another
00:02:09,166 bunch of useful information
00:02:10,500 like the 380 missing servings cost them $302 at cost
00:02:16,433 we measure the liquor cost very accurately
00:02:18,466 in this case 19.55%
00:02:20,966 and my favourite statistic
00:02:22,466 the software measures
00:02:23,366 is what your liquor cost would be if you'd scored 100%
00:02:28,000 a lot of people like to compare
00:02:29,200 to what they did last month
00:02:30,400 which has past deficiencies built in
00:02:33,000 or industry averages
00:02:34,066 and you don't have an industry average bar
00:02:36,666 the achievable cost is great
00:02:38,266 because it factors in what you're selling your product
00:02:40,566 for what you're buying it for
00:02:42,000 the product mix the specifics of the week's discounts
00:02:44,900 etcetera and so
00:02:46,200 the only difference between your score
00:02:48,400 and your achievable is the effect of missing product
00:02:51,666 so while you may never get to exact perfection
00:02:53,766 when you've got a live thing to aim at
00:02:55,900 a live target
00:02:56,966 it makes it much easier to get closer to that number
00:02:59,866 we also can calculate useful stats with
00:03:01,700 down to the serving
00:03:02,366 such as your average price you buy a serving for
00:03:05,433 and the average price
00:03:06,633 retail price you sell a serving for
00:03:08,900 and again that's on a per bar
00:03:10,966 on an overall bar and a per category basis
00:03:15,300 we do the same on individual items
00:03:16,866 so here I'm looking at a list of the items
00:03:18,800 in the liquor category that had more sold than poured
00:03:21,566 we joke and call that the Jesus Pour
00:03:23,433 probably means they rung something
00:03:24,633 and poured something else
00:03:26,200 or what is missing
00:03:28,566 and these are the opportunities to do better
00:03:30,100 so we take well vodka
00:03:31,633 we can see we're missing 63 servings
00:03:34,500 here is the detailed breakdown
00:03:35,966 so they started with 28 bottles
00:03:40,300 had purchased 36 today had 26
00:03:43,066 do the math means they poured 36 versus sorry
00:03:47,366 poured 38 having sold 35
00:03:50,033 so there's that 2.8 missing bottles or 63 servings
00:03:55,266 a reasonable question a bartender would ask is
00:03:57,000 how do I know that's true
00:03:58,600 and that's where the Detailed Product Viewer comes in
00:04:00,766 so the Detailed Product Viewer breaks down
00:04:03,000 all of the line by line
00:04:04,300 information that has LED to these calculations
00:04:06,366 so on the sales side
00:04:09,166 you see a breakdown of which buttons involved
00:04:11,600 the product in question how many times they were sold
00:04:14,500 the dollars taken per push the recipe
00:04:17,666 which we've written during setup
00:04:19,033 according to their exact specifications
00:04:21,633 and if you multiply the quantity sold by the recipe
00:04:24,100 setting you get the ounces sold
00:04:26,033 which you can convert to units or bottles
00:04:29,566 and then add it for all the items
00:04:31,266 and understand how we've concluded
00:04:33,266 we sold 35 bottles on the sale
00:04:36,900 also on the counting side to calculate our usage
00:04:40,033 these guys counted 26 bottles again
00:04:42,700 we see a breakdown of every shelf where their well
00:04:45,766 vodka is present
00:04:47,200 we know the weight of the bottle how full it is
00:04:50,600 or in this case how many bottles were counted
00:04:53,500 and that's then aggregated
00:04:54,766 so you can check the numbers before
00:04:57,766 results are finalized
00:04:58,600 so you learn from errors and know how to fix them
00:05:00,866 for next time
00:05:02,833 your results are more accurate
00:05:03,800 zeros have been fixed
00:05:05,100 and any true variances where you did
00:05:06,900 in fact use more or less than you
00:05:08,666 what you sold
00:05:09,800 have been confirmed before we finalize them
00:05:11,700 and ultimately this yields a higher confidence
00:05:14,466 and you can move the conversation on with your staff
00:05:16,366 and start stop talking about maybe this
00:05:18,266 maybe that and say this is the numbers
00:05:20,300 let's think about how we pause those numbers and how
00:05:23,233 what we can do to fix it um
00:05:25,700 this is not magic so typically I said a bar scores 85%
00:05:30,400 we are able by repeating this process
00:05:34,000 doing the hard work in between to update point of sale
00:05:36,600 do our better accounting learn from those
00:05:39,566 we can turn that around and get your losses 5% or less
00:05:42,866 and typically
00:05:43,600 our clients reduce their full liquor cost by 3
00:05:46,233 full percentage points
00:05:48,466 it also gives you clarity on how you're doing
00:05:51,200 compared to where you could or should be um
00:05:54,033 and you can compare
00:05:56,000 your results against recent history
00:05:58,766 so for instance I'm moving on from well vodka here um
00:06:03,300 we also can see a breakdown but um
00:06:06,366 here is a a different client here
00:06:09,033 who's been a client just for 10 weeks
00:06:11,500 long cycles
00:06:13,366 at the start of the process as is often the case
00:06:15,466 you see the results jump from 92 to 84
00:06:17,500 that's probably a a men a measurement error
00:06:20,400 then we start to hit our stride
00:06:21,633 and see a bit more consistency
00:06:22,866 and you see in this middle part
00:06:24,700 the results in the early first few weeks
00:06:26,966 we worked with them
00:06:28,066 were in the sort of mid or low nineties
00:06:31,066 and the midpoint of the losses that the
00:06:33,433 this bar graph is showing
00:06:34,433 the losses was somewhere around 150
00:06:38,366 maybe dollars a week
00:06:40,000 when we saw this nice jump from one week scoring 86
00:06:43,633 88 and then the last few weeks
00:06:45,766 we've been scoring the high 90s
00:06:47,300 we see that the midpoint of the losses is now down to
00:06:50,566 in one case just $17 missing or 70
00:06:53,200 but you can track how you're doing and see the
00:06:56,633 the effect in in real time and in real dollars
00:06:59,566 so this allows you to make data driven decisions
00:07:01,966 hold your staff accountable
00:07:03,966 um and you also can manage your product selection um
00:07:07,366 more effectively with our ordering tool
00:07:09,600 which will compare your dynamic powers
00:07:11,200 against inventory in hand
00:07:12,066 and tell you what you need to order
00:07:13,400 as well as submitting those orders to your
00:07:15,800 distributors directly via email
00:07:18,166 if this is looking like a level of detail
00:07:21,400 accuracy that you don't have at your bar
00:07:23,800 please schedule a demo
00:07:24,833 we'd be happy to talk about how we can set this up
00:07:26,766 at your bar and start turning those missing servings
00:07:29,766 into more dollars in the
00:07:31,800 your pocket and the bottom line thanks for watching


.png)