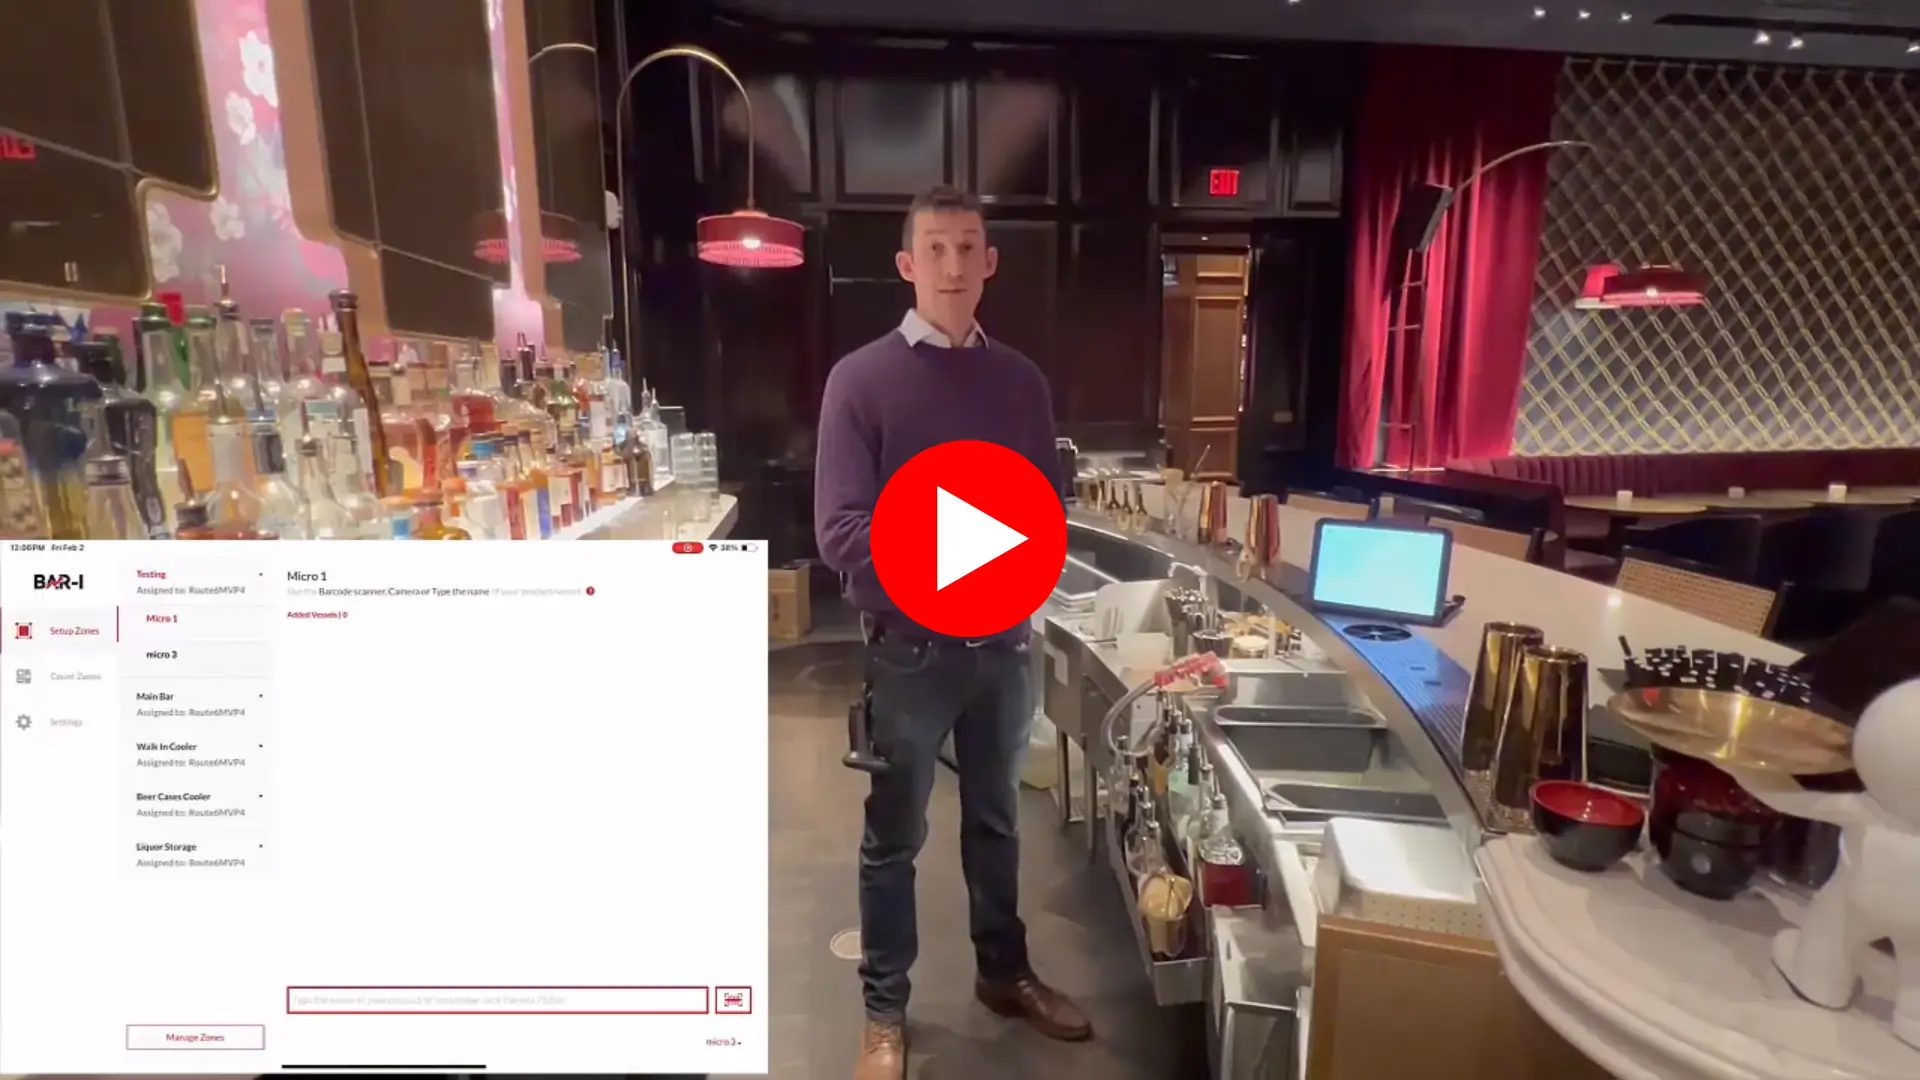
00:00:02,300 this is bar I make counting count video series
00:00:05,366 where we show you how you can use our
00:00:06,633 down to the serving approach
00:00:07,766 to bar inventory
00:00:08,800 to increase profits at your bar by 30% on average
00:00:12,100 in this video
00:00:12,800 we're gonna look at how we can use product level
00:00:15,300 liquor cost to dial in pricing
00:00:17,766 so at this particular bar
00:00:18,966 we can see that this week their overall cost was 23.7
00:00:22,700 but the achievable cost
00:00:23,966 what their liquor cost would have been
00:00:25,366 without missing products is 20.1%
00:00:28,200 so when I look down at the categories here
00:00:31,066 I see everything looks pretty good
00:00:32,400 but to me the bottle beer is an outlier here
00:00:34,600 typically we see bottle beer costs
00:00:37,400 the range of 4 to 8% higher than draft beer
00:00:40,566 so in this case
00:00:41,266 where the bottle beer cost is 12% higher
00:00:43,766 that to me
00:00:44,300 would be a flag
00:00:45,000 and would be right for some price increases
00:00:48,966 so now
00:00:49,466 if we look here and filter the results by bottled beer
00:00:53,300 we can look on a product by product basis
00:00:54,900 so looking here at our collection of domestics
00:00:57,866 we can see that all the costs are above 30%
00:01:02,800 apart from Bush so I think potentially
00:01:05,433 it would be smart to increase in prices
00:01:08,066 um on our pills nose
00:01:09,966 we're in the high 20s and low thirties um
00:01:13,566 that's okay holiday favourite
00:01:15,600 blonde more expensive beer
00:01:17,000 it's 2:30 a can probably need to up the price on that
00:01:20,200 another standout here is these two neutrals
00:01:22,433 these are Seltzer like products um
00:01:25,000 actually made with vodka in this case
00:01:26,633 but the cost we're hitting here is 47
00:01:29,300 basically 50% and it said
00:01:31,866 the cost on some of these
00:01:33,366 cell site products is kind of high
00:01:34,966 and ultimately
00:01:35,566 we need to be selling them for a little bit more
00:01:37,600 in order to hit our goals
00:01:38,766 and maybe get that cost down in the range of
00:01:40,900 sort of lower mid twenties
00:01:42,866 one final look here
00:01:44,066 this is the loss and accountable sorry
00:01:45,766 the liquor cost report
00:01:47,066 and I've used the manage colors feature here to
00:01:50,366 just get the costs and sales per serving
00:01:53,033 as well as a rank order we can just see
00:01:55,700 where these Bottle Bay products are falling
00:01:58,233 obviously the higher the rank um
00:02:00,466 the the the worse the liquor cost is um
00:02:03,366 and one of course thing to pay attention to here is
00:02:05,633 the higher volume products
00:02:07,066 little price increase on those
00:02:08,266 will obviously have a higher impact on overall costs
00:02:11,000 so we might
00:02:11,666 you know put those costs more on those high movers um
00:02:14,900 to see overall cost reduce
00:02:16,800 so that's how we use product level
00:02:18,433 liquor cost to dial in pricing thanks for watching


.png)