00:00:00,000 you see your accountability score
00:00:01,800 but what does that mean in cold hard cash
00:00:04,700 here's what it means for our clients
00:00:06,500 a high volume sushi bar
00:00:08,300 with over $110,000 in weekly sales
00:00:11,666 they're losing just $143 at cost
00:00:15,066 a bowling alley with more modest sales
00:00:17,366 Just $49 lost an upscale seafood spot
00:00:20,766 only $25 in this third episode of Barry's fabulous
00:00:24,866 four bar series
00:00:26,366 we're looking about how the accountability
00:00:28,300 score that a bar receives
00:00:30,066 correlates to the dollar value of their loss
00:00:32,800 at wholesale
00:00:33,900 which tells us the amount of money they're missing
00:00:36,466 that was poured but not sold at wholesale cost
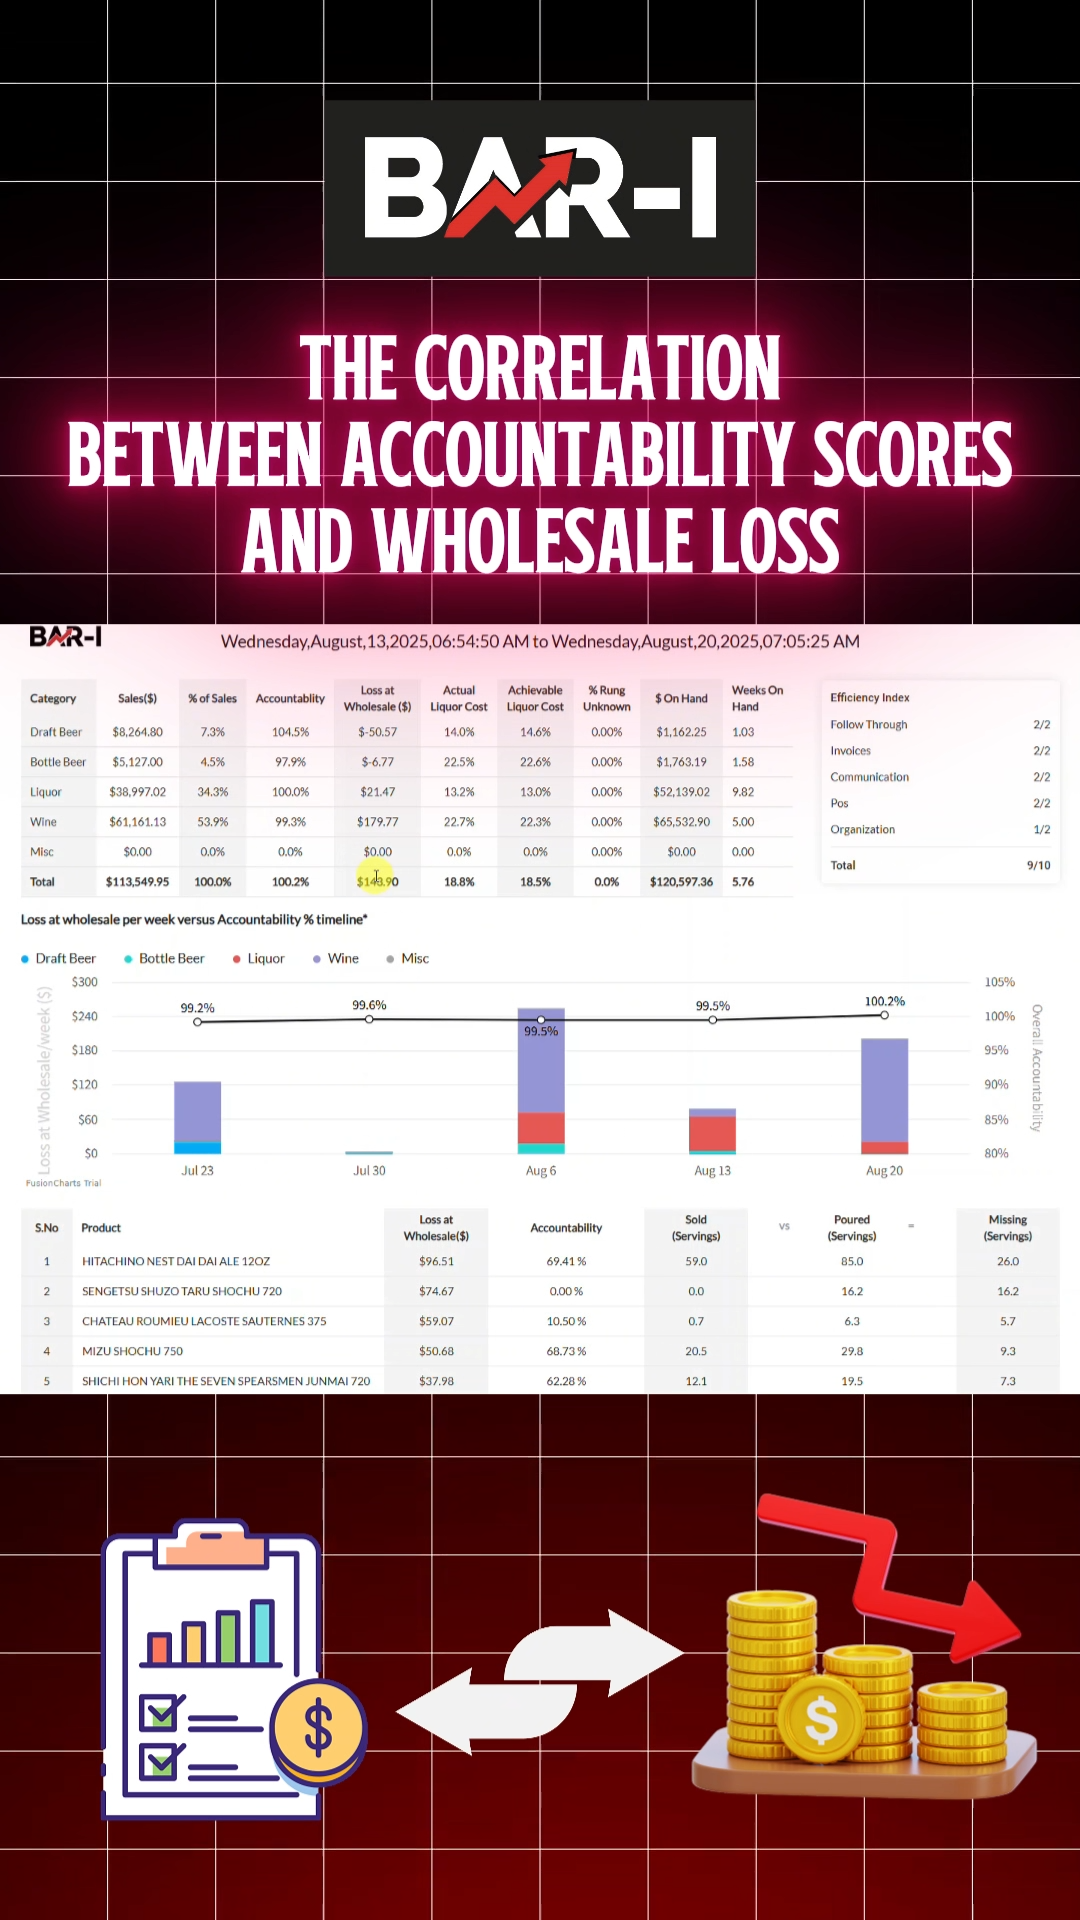
00:00:40,433 so starting here with our high end sushi bar
00:00:43,266 despite having really high weekly sales
00:00:45,233 of over $110,000
00:00:47,700 they are missing just $143 at wholesale
00:00:52,100 one way of course
00:00:52,866 of looking at that is with a liquid cost below 20%
00:00:55,866 the retail loss of this is over five times that amount
00:01:00,433 which would be over $700
00:01:03,500 moving on to our Midwest bowling alley
00:01:06,733 we see
00:01:07,200 they have more modest sales of $10,000 in the week
00:01:10,200 but they're missing just $49 at cost
00:01:13,633 obviously this bar with a higher liquor cost
00:01:16,633 needs to be especially careful about
00:01:18,866 guarding against losses
00:01:20,233 because their profit margins in general are lower
00:01:23,366 given that they're in a more cost sensitive market
00:01:26,900 moving on here to our pizza restaurant
00:01:29,033 they're running a liquor cost
00:01:30,433 in the range of a typical neighborhood bar
00:01:32,666 and again on about $9,000 in sales
00:01:35,866 missing just $58 one
00:01:38,366 thing you can notice here with the timeline graph is
00:01:41,900 in general
00:01:42,633 when the black line goes up and the score goes up
00:01:45,500 you should notice that the losses go down
00:01:48,333 so this is a little bit of an anomaly in the first
00:01:51,500 transition here but then the next transition
00:01:54,266 our accountability
00:01:55,033 score goes down by about 4 percentage point
00:01:58,033 causing losses to increase
00:01:59,766 and then we see a nice bounce back the following week
00:02:02,300 where accountability score went from 92
00:02:04,566 essentially to 98 and losses were about halved
00:02:08,900 finally
00:02:09,833 looking at our high end seafood restaurant doing really
00:02:14,466 really solid sales
00:02:15,400 over a two week cycle of almost $47,000
00:02:19,833 and they're missing just about $25
00:02:23,000 despite the really high sales level
00:02:25,166 once again
00:02:25,700 just shows us that it's hard to predict what your look
00:02:28,966 losing what your lick cost is
00:02:30,900 but when you can see the
00:02:32,366 relationship between your accountability score
00:02:35,000 your losses and your lick cost
00:02:36,766 it puts you in a position to make data driven decisions
00:02:39,700 increase profit and hold your staff members to account
00:02:42,800 thanks for watching


.png)
.webp)
.webp)