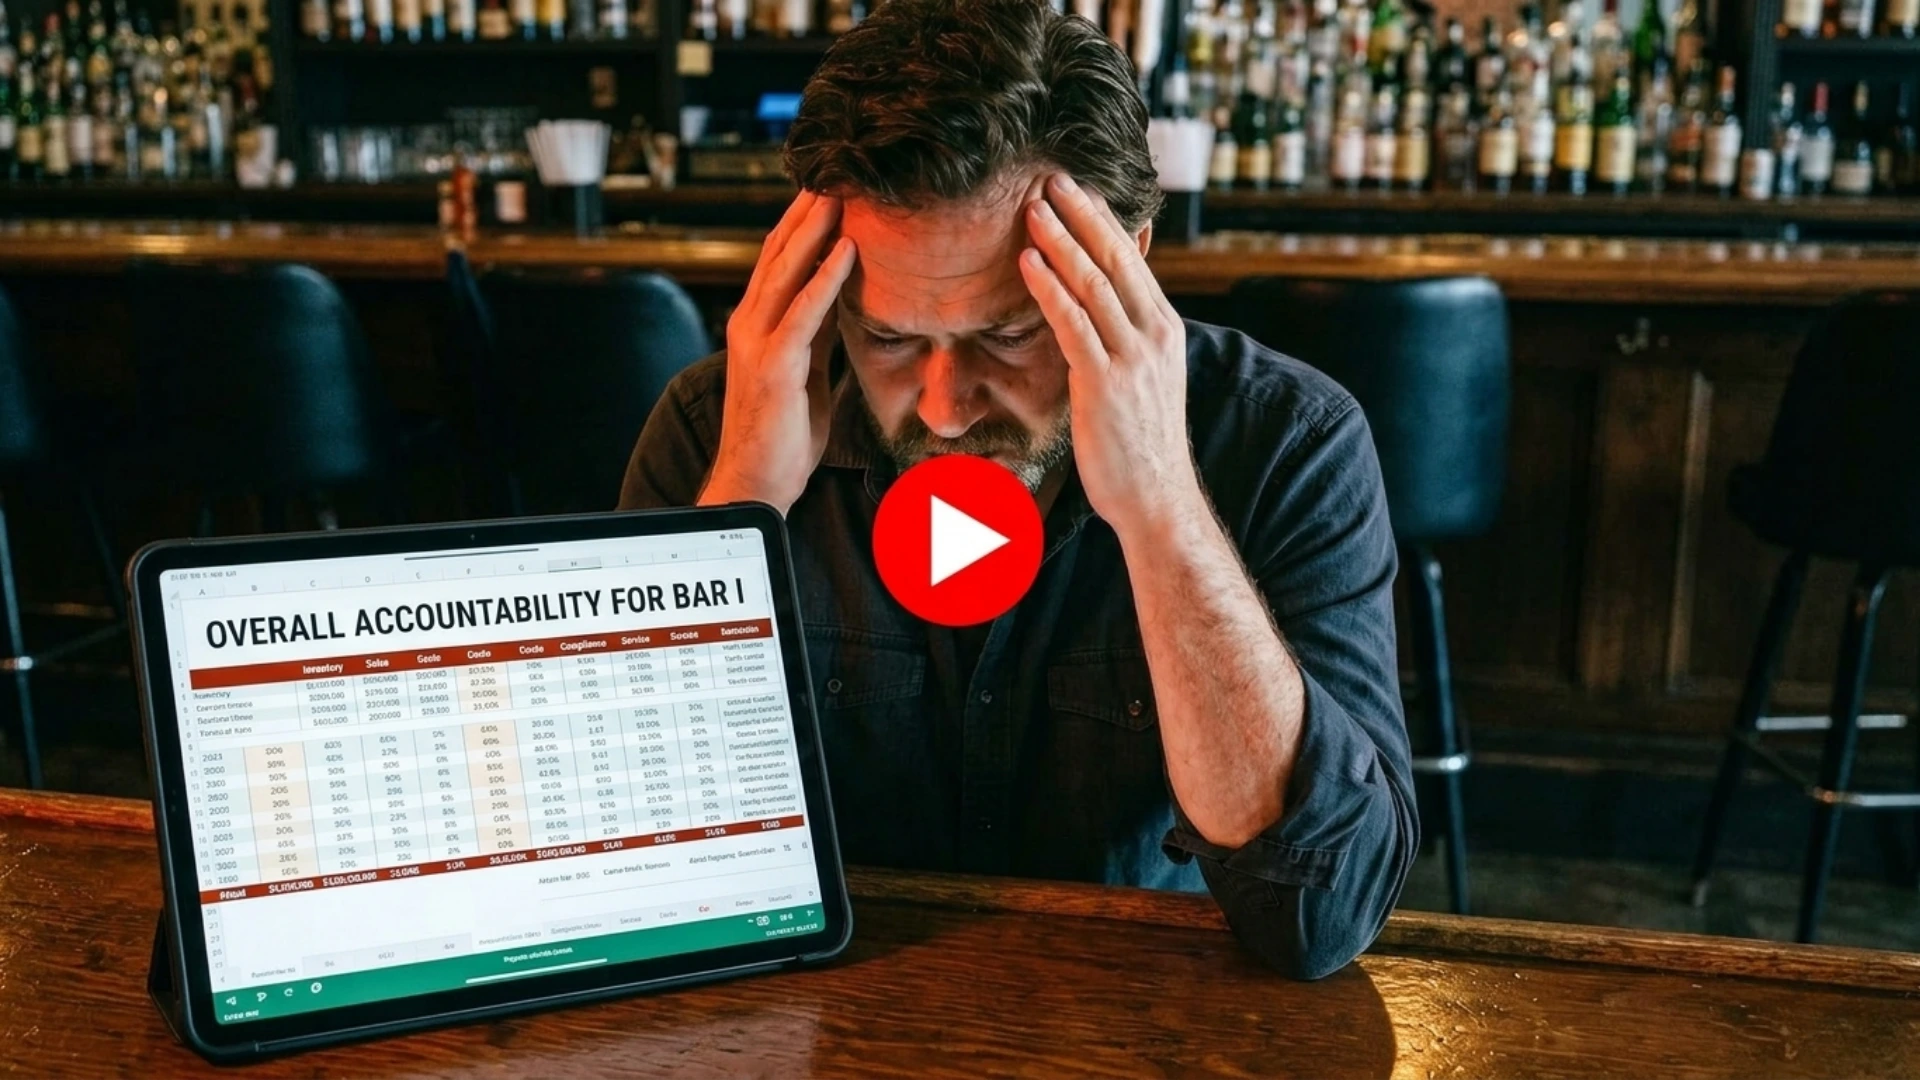
00:00:00,000 do you wonder where your bar's liquor cost is
00:00:02,033 compared to where it should be
00:00:03,566 this particular bar accounted for 95.56% of the product
00:00:07,866 was poured during the week
00:00:09,200 the end result was that overall liquor cost was 19.35%
00:00:14,133 however their achievable liquor cost
00:00:15,866 shows them where their liquor cost would have been
00:00:17,966 if every drink was poured
00:00:19,100 exactly according to protocol
00:00:20,900 and in this case the achievable cost is 17.8%
00:00:24,566 what this shows is that liquor cost is being inflated
00:00:26,866 by about one and a half percentage points
00:00:29,066 due to that missing product
00:00:31,066 down to the serving
00:00:31,800 inventory allows you to see these specific insights
00:00:34,066 so you can run a more profitable bar
00:00:36,900 count fast see results down to the serving

.webp)

.png)
.webp)
.webp)
.webp)
.webp)
.webp)
.webp)
.webp)
.webp)
.webp)
.webp)
.webp)




.webp)
.webp)