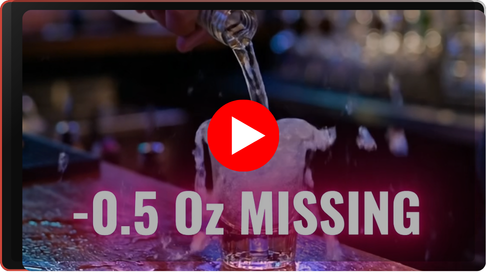
00:00:00,166 managing by average is losing you money
00:00:02,966 BAR I
00:00:03,500 shows you the gap between actual and achievable cost
00:00:06,366 for every single bottle BAR I's down to the serving
00:00:09,400 approach to beverage inventory
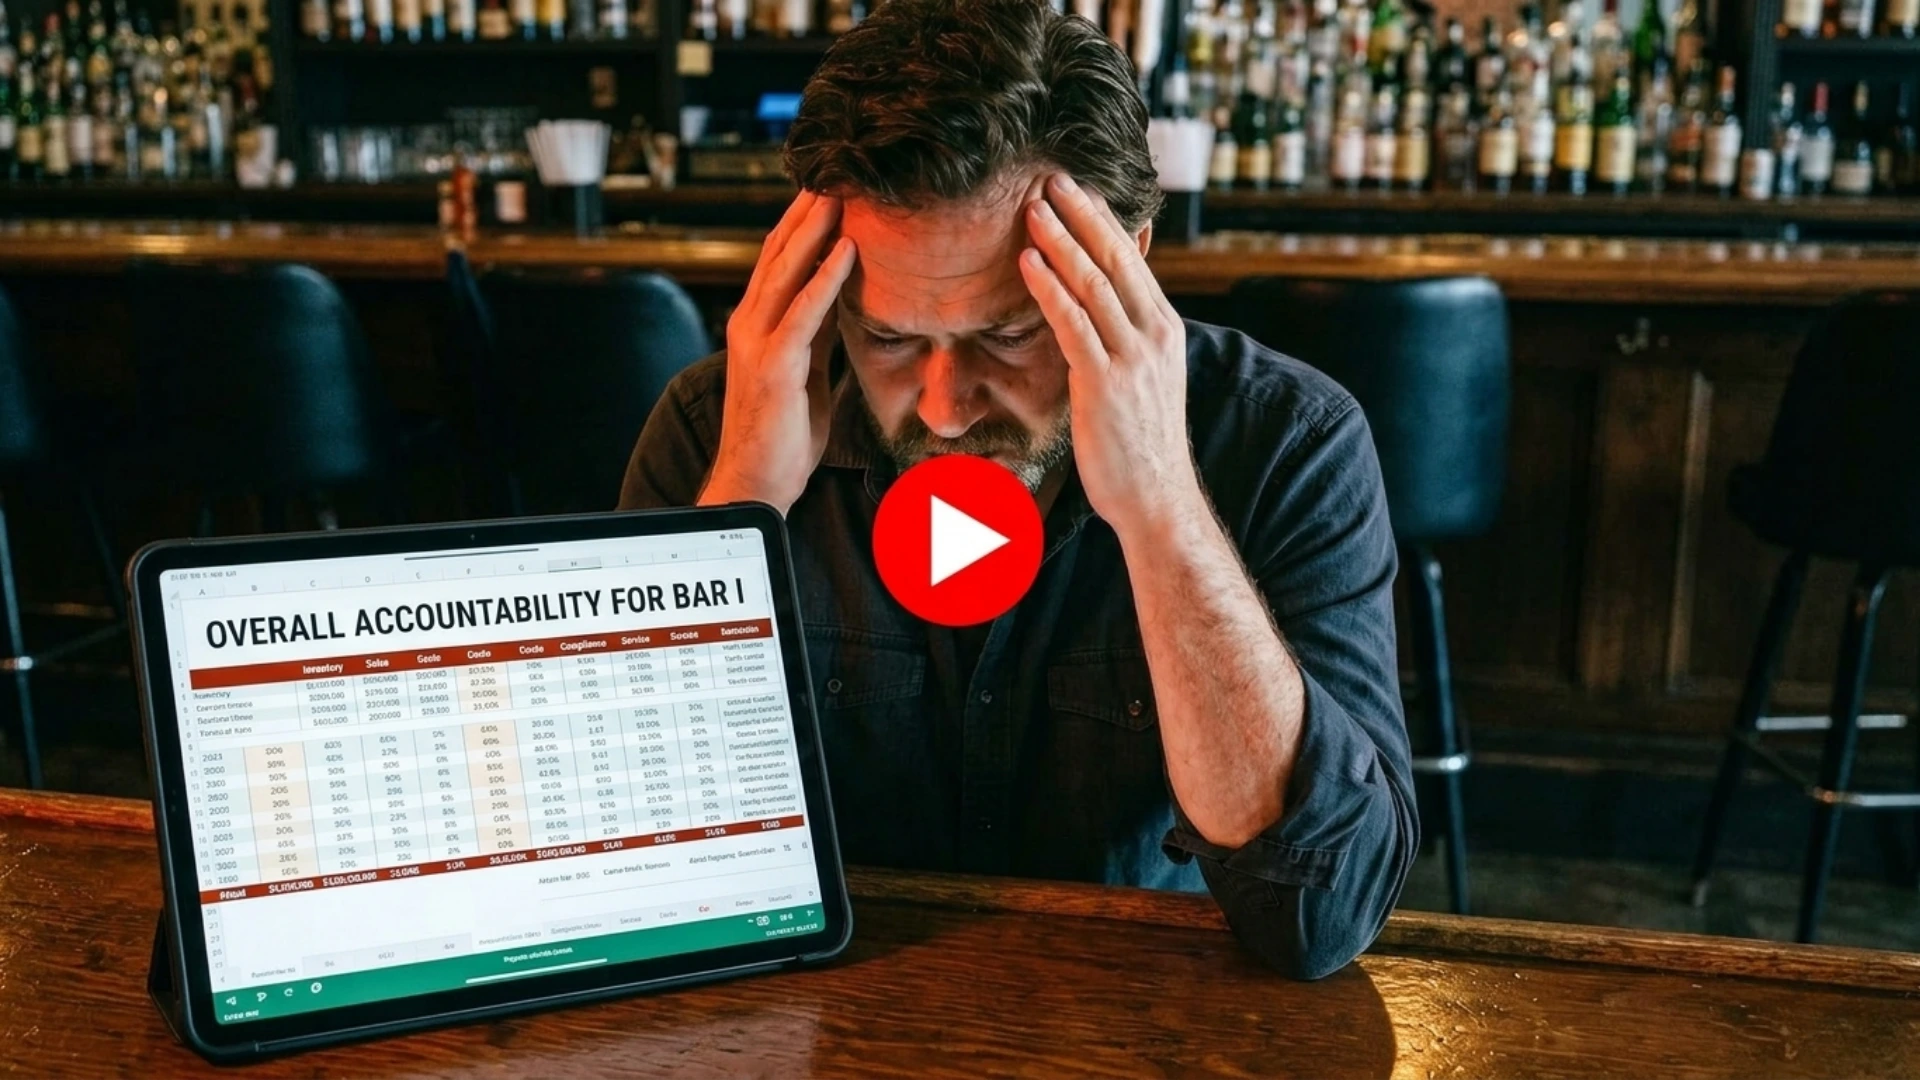
00:00:11,100 means that
00:00:11,466 in addition to seeing a liquor cost for the bar overall
00:00:14,266 and each category our clients can see a product level
00:00:17,700 liquor cost for every item at the bar
00:00:19,933 as well as an achievable cost
00:00:22,100 which shows what your liquid cost would have been
00:00:24,400 if you poured and sold the exact same amount
00:00:28,033 by managing the difference
00:00:29,166 between your actual and achievable cost
00:00:31,366 our clients achieve better results and higher profits
00:00:36,566 count fast see results down to the serving

%5B1%5D.webp)

.png)
.webp)
.webp)
.webp)
.webp)
.webp)
.webp)
.webp)
.webp)
.webp)
.webp)
.webp)


.webp)
.webp)