00:00:00,066 if you don't know the margin
00:00:01,500 of every single button on your POS
00:00:04,233 you're leaving money on the table
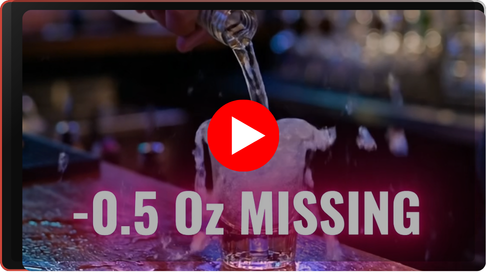
00:00:06,433 bar eyes down to the serving
00:00:07,866 approach to bar inventory means that
00:00:10,033 in addition to seeing the liquid cost for your bar
00:00:12,466 overall
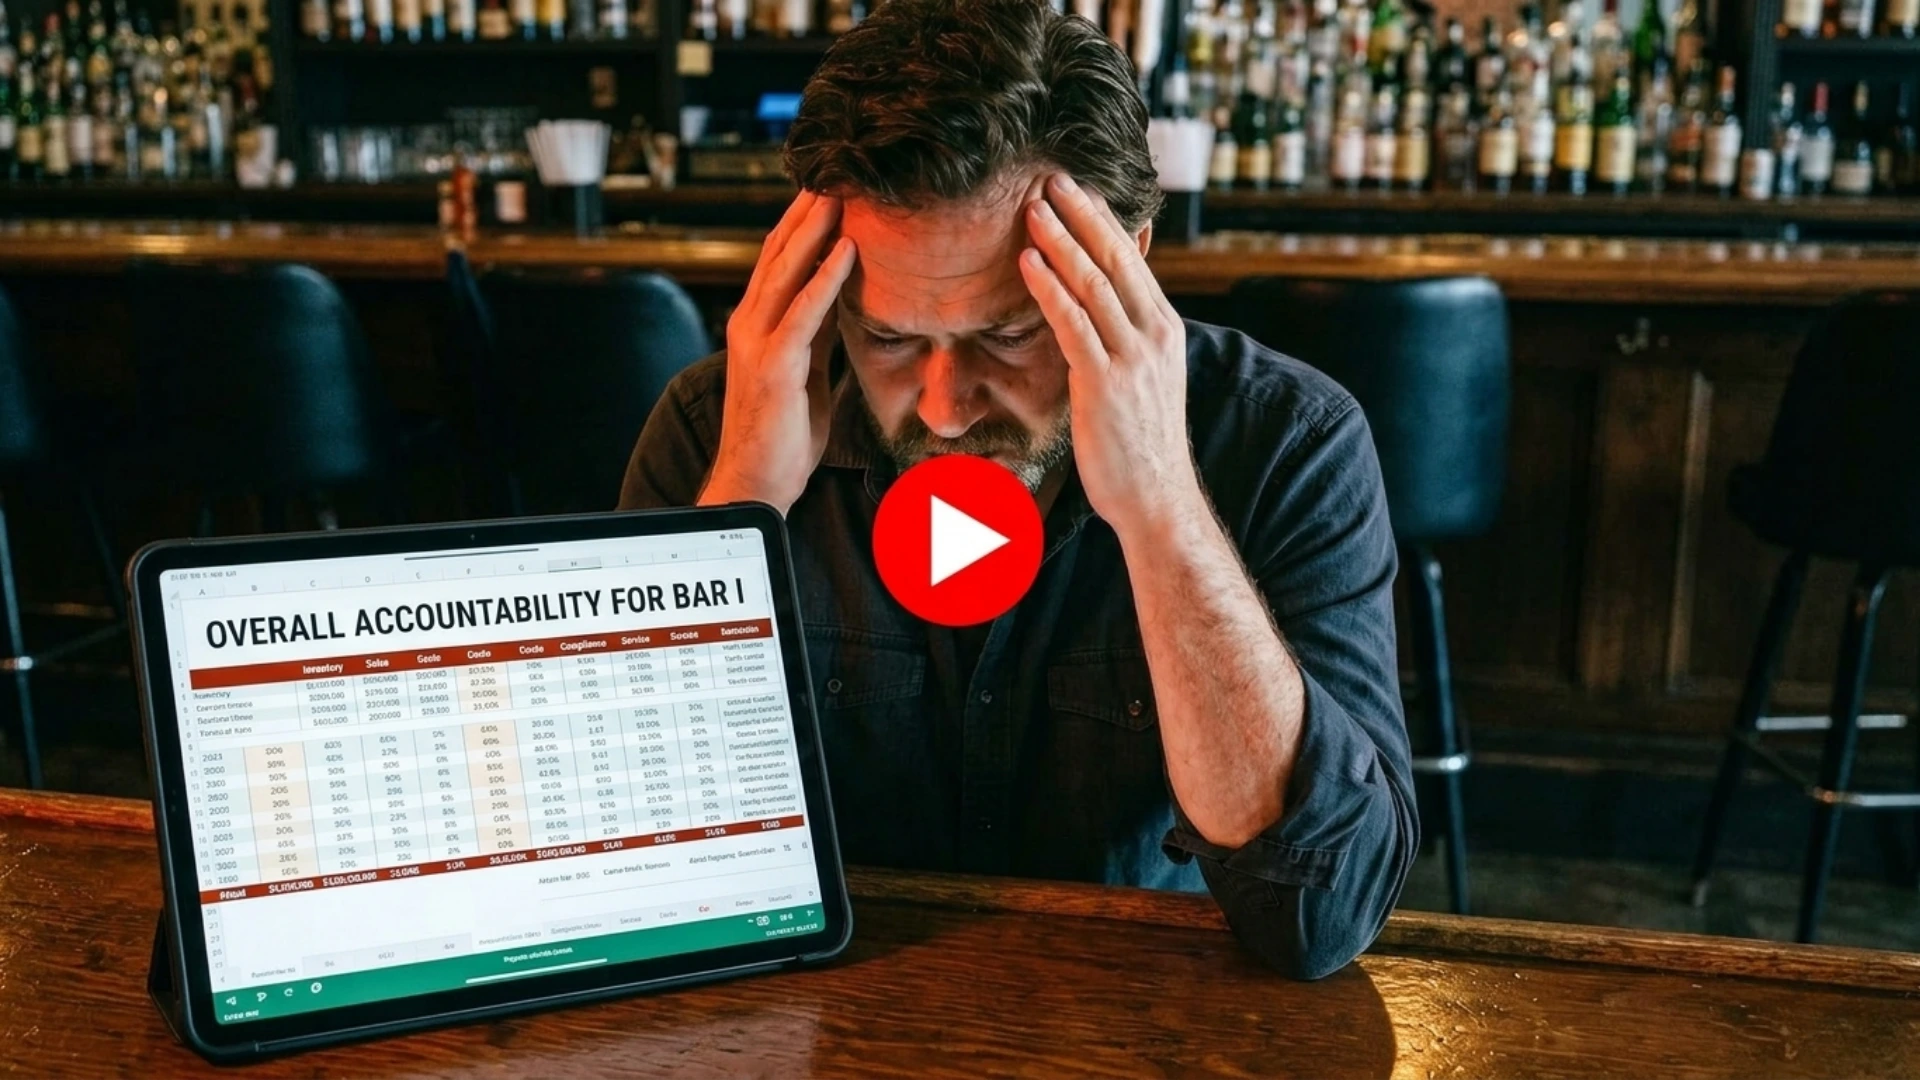
00:00:13,366 our clients see the liquid cost at the button level
00:00:16,766 for every single button
00:00:18,533 we'll calculate the cost of the ingredients
00:00:22,000 see the average retail sales
00:00:24,433 and see the liquor cost
00:00:25,666 of every single button in the system
00:00:27,400 so you can see which drinks are driving lower cost
00:00:30,566 and which costs are higher
00:00:33,033 pats can be adjusted when you have the right data
00:00:35,600 it's easy to make decisions
00:00:37,633 count fast see results down to the serving

%5B1%5D.webp)

.png)
.webp)
.webp)
.webp)
.webp)
.webp)
.webp)
.webp)
.webp)
.webp)
.webp)
.webp)


.webp)
.webp)